Results
Project Specifications and Justifications
The list of all project specifications developed during the proposal phase were met and are listed below:
1. FPGA correctly interprets the barcode scanner signal, including proper synchronization and sampling.
2. FPGA and MCU communicate reliably over SPI.
3. The system generates audio within the 200–2000 Hz range by FM-modulating a tone on the microcontroller.
4. Audio playback activates only when the barcode scanner’s trigger is pressed.
5. The pitch of the sound changes according to the barcode being scanned.
6. The MCU employs a new peripheral (the DAC) to drive the audio output.
7. There is no audible latency between scanning and the start of the note.
8. The FIR filtering function is applied to each note to smooth the waveform.
9. Thomas and Leilani wear stripes. 🦓
10. The system reliably detects barcode scans under normal use.
11. The system recovers gracefully after an interrupted scan without requiring a reset.
12. No audible clipping, harsh artifacts, or digital noise are present in the output.
Each specification was properly met as shown through the real-time demonstration in the linked YouTube video, the attached oscilloscope traces, the model SPI transaction and affiliated MCU readings, and the FPGA testbench waveforms.
Video Demonstration
Listen to the barcode instrument in action in the video below!
Modulated Waveforms from DAC
Oscilloscope traces demonstrate reliable frequency modulation on all tested barcodes, with frequencies falling within the desired range. The periods of each oscillation are visibly variable, with cursors and built-in frequency measurements confirming proper behavior. The top image shows a recent frequency measurement of 510 Hz and the second image shows a 1 kHz frequency being recorded. The modulation varies based on the distance the scanner is from the sequence and the scanner’s movement over the pattern. Even if calculated frequencies fall beyond this range, they are capped at 200 Hz or 2 kHz.


FPGA to MCU Communication with SPI
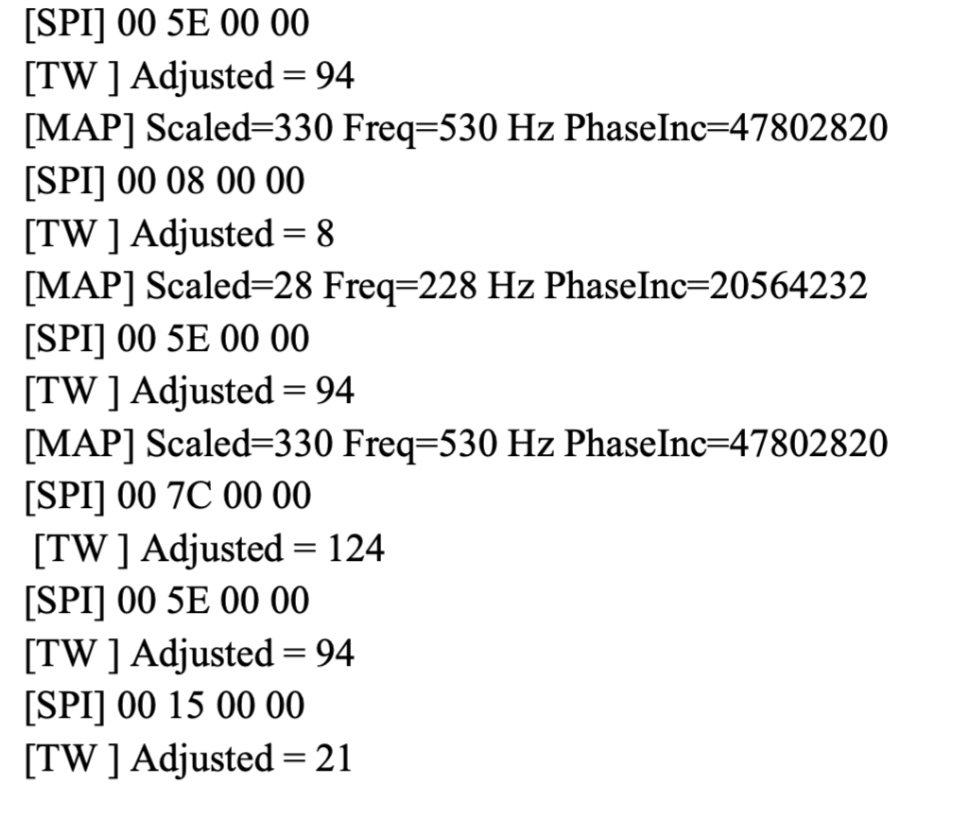
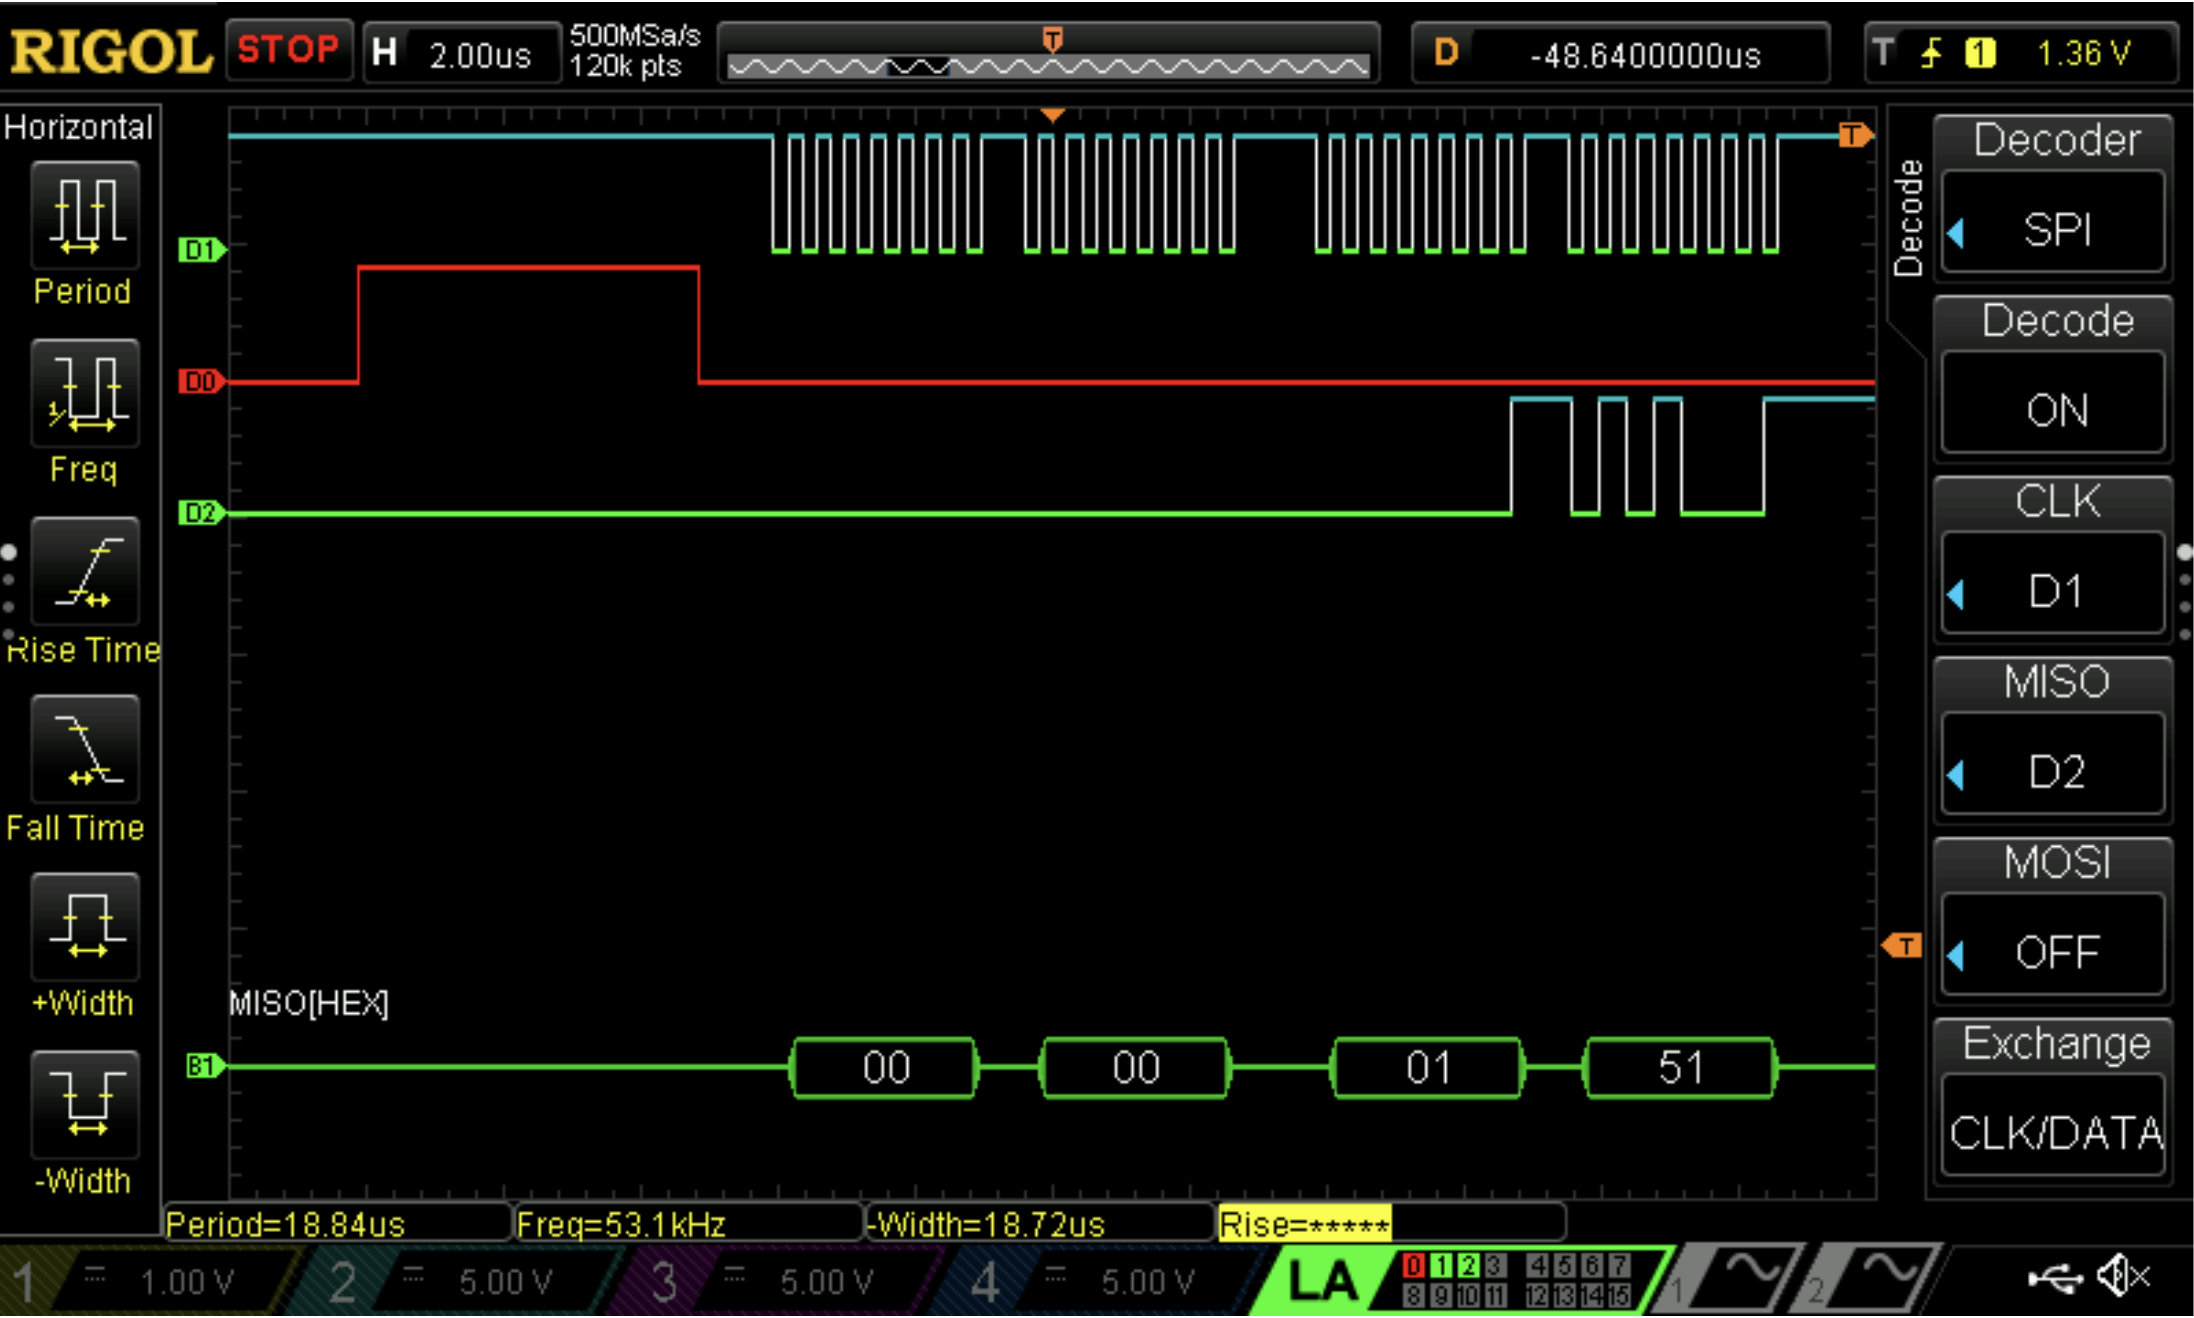
The decimated FIR filter outputs a 32-bit tuning word calculated on the FPGA is sent to the MCU via 4 8-bit SPI transactions at a 2 MHz baud rate. Communication between the two decives is unidirection, with the MCU operating as the driver, receiving tuning word packets over the MISO line, and the FPGA behaving as the pheripheral, receiving unused zeros in return. Given the selected 8-tap filter weights, tuning word values should range between 0 and 506. Figure 3 illustrates the reconstructed tuning word received by the MCU, and Figure 4 showcases the correct data packet communication on the logic analyzer.
Top Module Waveforms
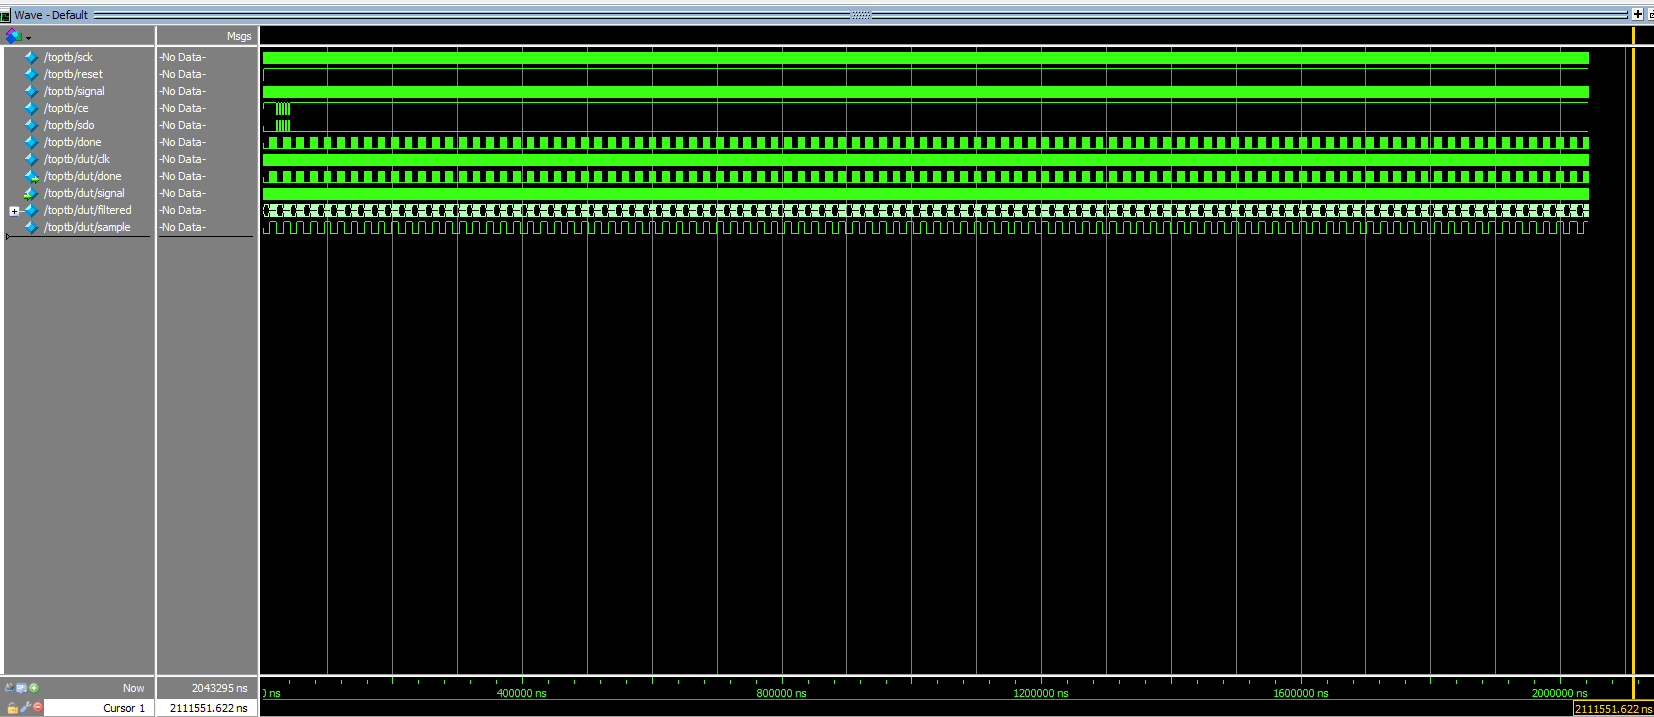
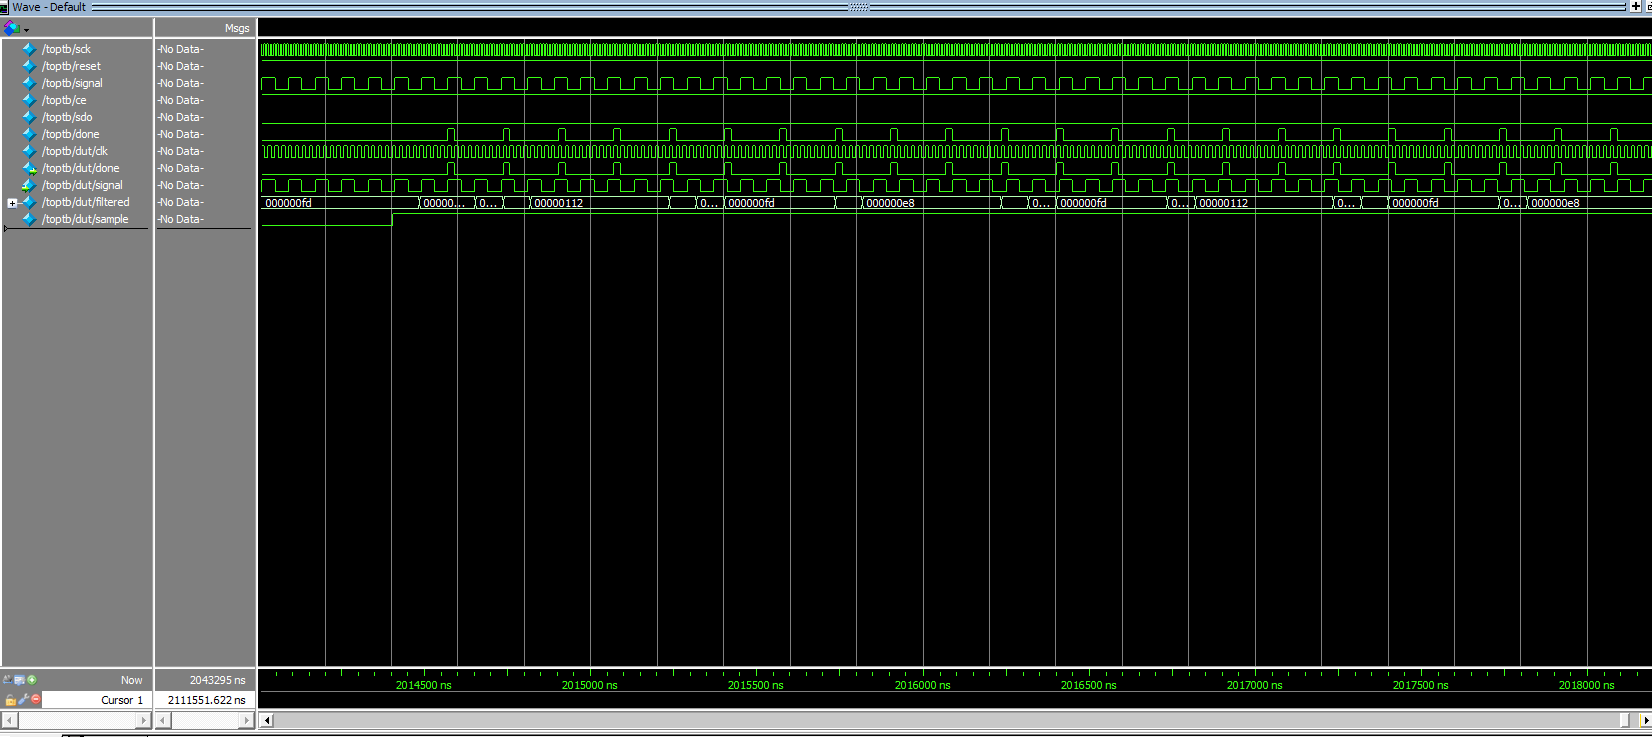
The top module waveforms test the full FPGA system function, including the filter core, which consists of signal synchronization and filtering mechanics, and the the SPI communication file (Figure 5). Figure 6 provides more granular resolution to the intricate processes executing in the FPGA implementation
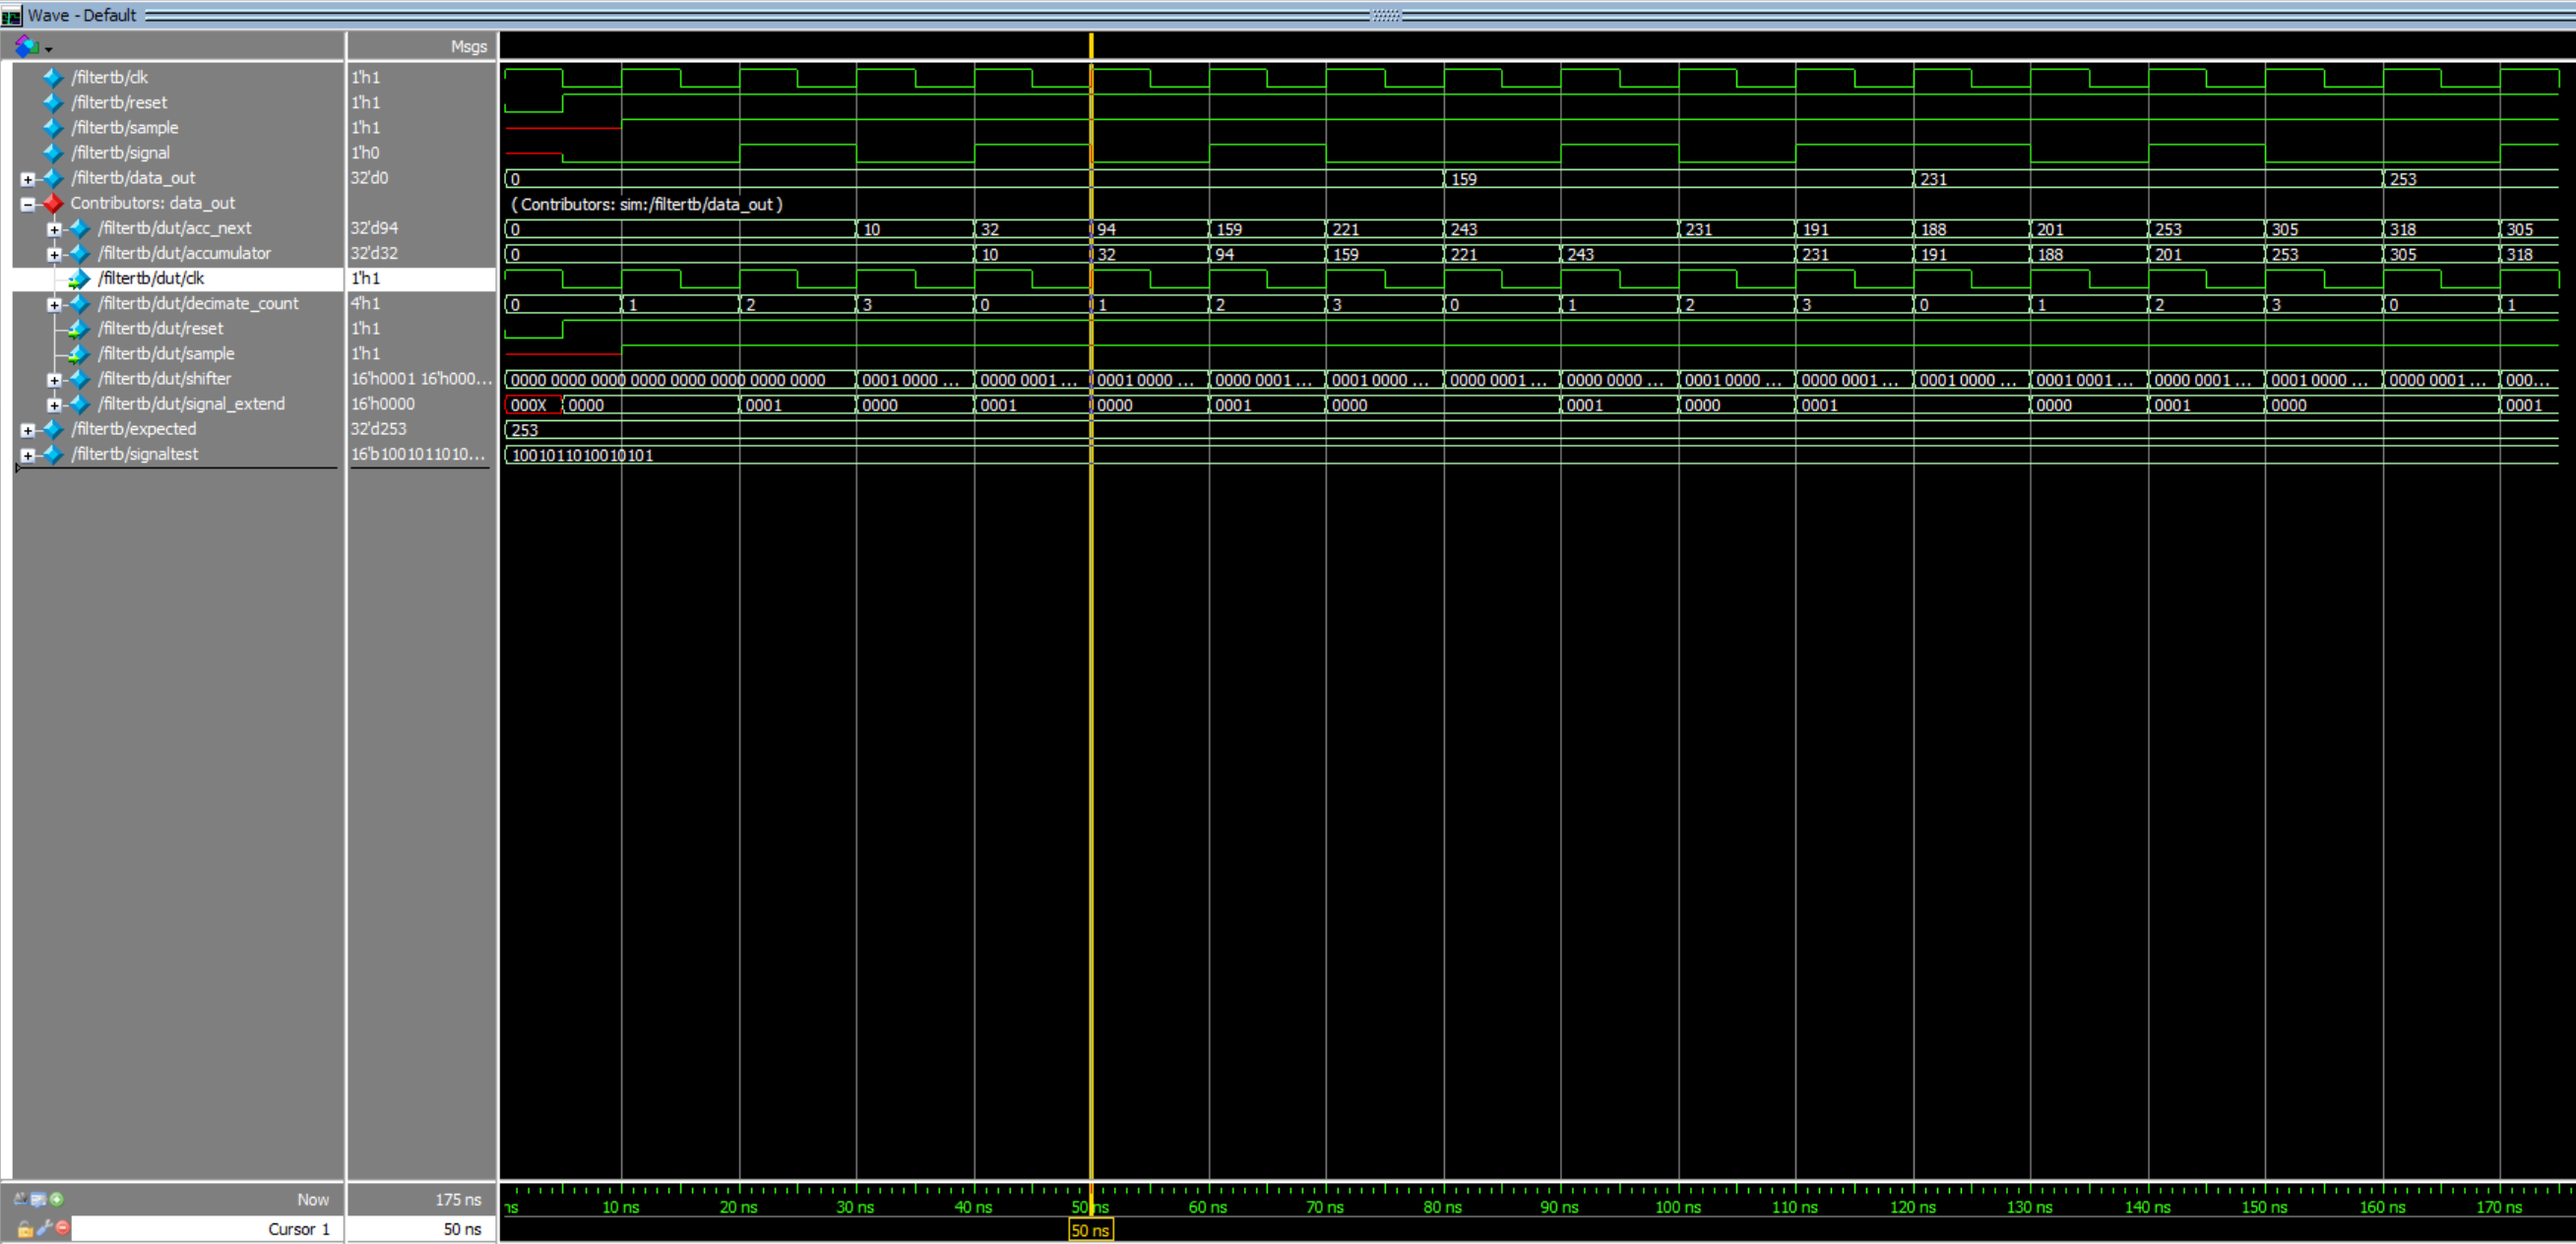
Decimated FIR Core Waveforms
The filter and decimation mechanics were tested with random input binary inputs representing a sampled square wave. Figure 7 showcases proper filtering performance for an input of a “sampled” input of 11011000. The achieved tuning word output of 253 matches the expected output calculated by hand.
Physical System Implementation
Figure 8 showcases the full breadboarded installation of the system, demonstrating the physical connections between the scanner inputs, the FPGA, the MCU, and the audio amplifier with a gain of 20.
